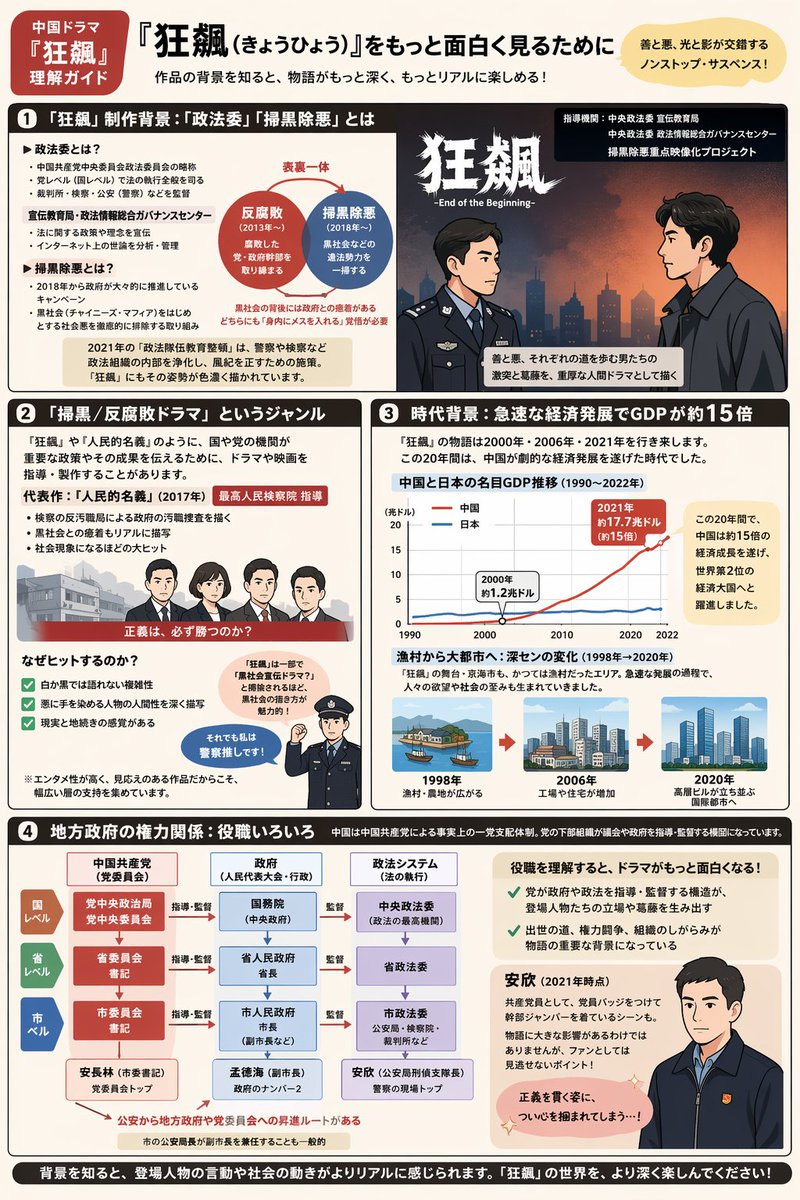
Complex Infographic Explainer Sheet
Generates a highly detailed, multi-section infographic with charts, flowcharts, and vector illustrations.
vues555
j’aime4
commentaires1
partages0
favoris2
citations0
{
  "type": "comprehensive infographic explainer sheet",
  "style": "{argument name=\"illustration style\" default=\"flat vector anime style\"}",
  "color_palette": "{argument name=\"color palette\" default=\"beige background with dark brown, red, and blue accents\"}",
  "layout": {
    "header": {
      "tag": "中国ドラマ『狂飆』理解ガイド",
      "main_title": "{argument name=\"main title\" default=\"『狂飆(きょうひょう)』をもっと面白く見るために\"}",
      "subtitle": "作品の背景を知ると、物語がもっと深く、もっとリアルに楽しめる!",
      "top_right_badge": "善と悪、光と影が交錯するノンストップ・サスペンス!"
    },
    "sections": [
      {
        "number": 1,
        "title": "「狂飆」制作背景:「政法委」「掃黒除悪」とは",
        "components": [
          {"type": "bulleted text", "description": "Definitions of political terms"},
          {"type": "diagram", "description": "2 overlapping circles labeled 反腐敗 and 掃黒除悪"},
          {"type": "illustration", "description": "2 men facing each other in profile; 1 in a police uniform, 1 in a dark suit with a red tie"}
        ]
      },
      {
        "number": 2,
        "title": "「掃黒/反腐敗ドラマ」というジャンル",
        "components": [
          {"type": "illustration", "description": "Lineup of 4 characters (3 men, 1 woman) behind a red banner"},
          {"type": "checklist", "count": 3, "description": "Reasons for the hit, with green checkmarks"},
          {"type": "illustration", "description": "1 police officer pointing upwards with a speech bubble"}
        ]
      },
      {
        "number": 3,
        "title": "時代背景:急速な経済発展でGDPが約15倍",
        "components": [
          {"type": "chart", "chart_type": "{argument name=\"chart type\" default=\"line chart comparing two trends over time\"}", "description": "GDP comparison between China and Japan (1990-2022)"},
          {"type": "timeline", "count": 3, "description": "City evolution showing 3 stages: 1998 village, 2006 factories, 2020 modern high-rise city"}
        ]
      },
      {
        "number": 4,
        "title": "地方政府の権力関係:役職いろいろ",
        "components": [
          {"type": "flowchart", "topic": "{argument name=\"flowchart topic\" default=\"Local government power structure\"}", "description": "3x3 grid showing National, Provincial, and City levels across Party, Government, and Legal systems"},
          {"type": "illustration", "description": "1 man in a dark jacket looking forward, with text explaining his role"}
        ]
      }
    ],
    "footer": {
      "text": "背景を知ると、登場人物の言動や社会の動きがよりリアルに感じられます。「狂飆」の世界を、より深く楽しんでください!"
    }
  }
}


