Editorial Dual-Axis Data Infographic
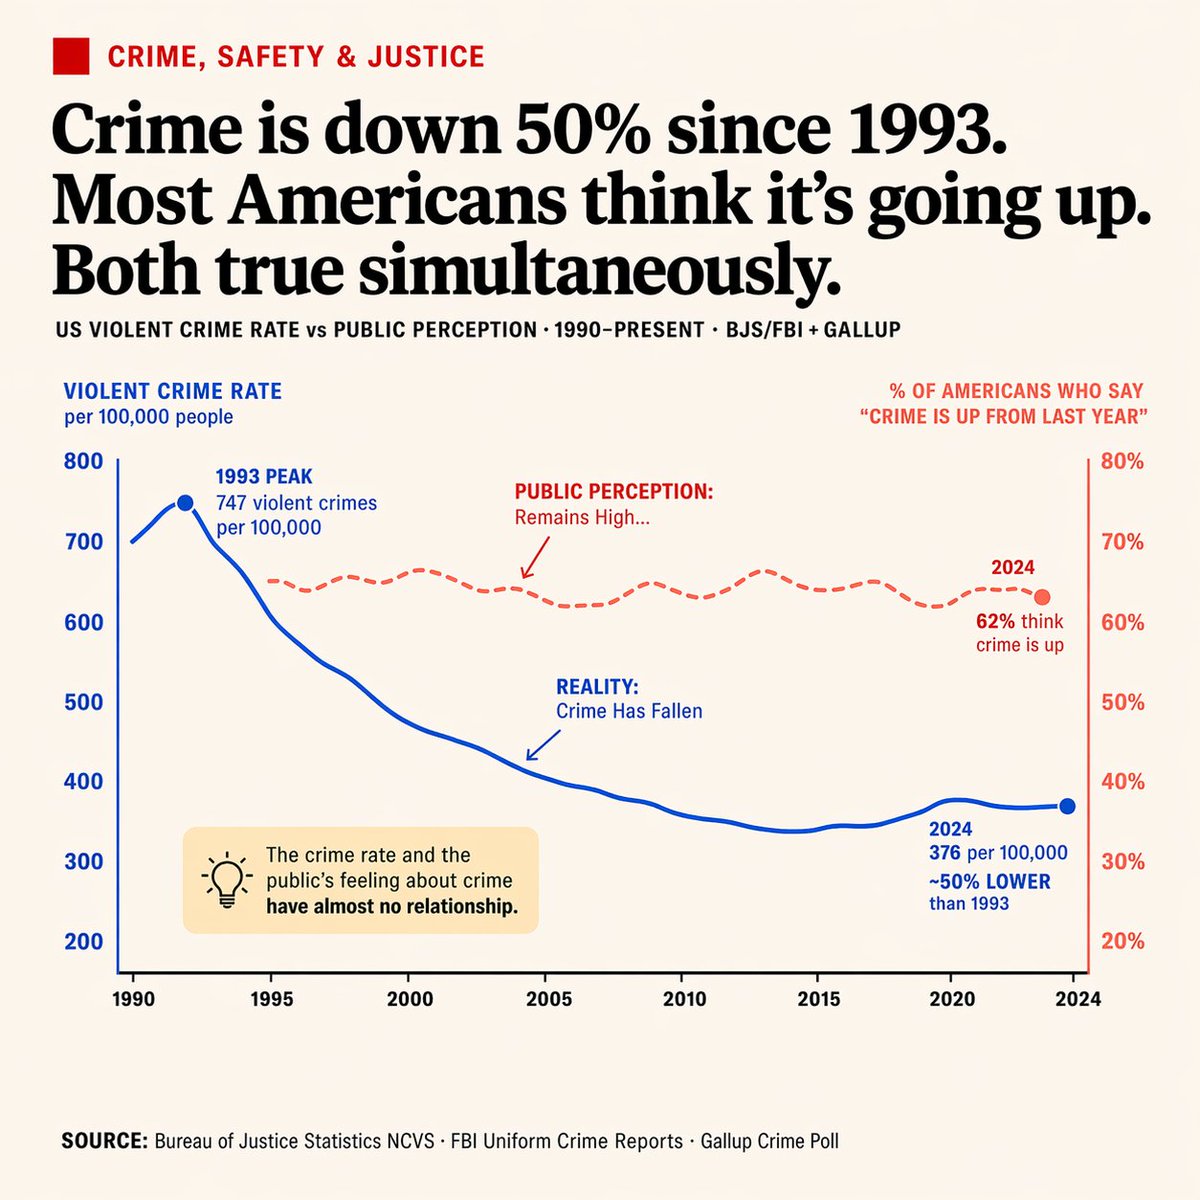
Generates a clean, newspaper-style dual-axis line chart with annotations and a callout box, ideal for comparing contrasting data trends.
프롬프트
{
  "type": "편집용 인포그래픽 이중 축 선 그래프",
  "style": "깔끔한 신문 스타일, 오프 화이트 배경, 가독성이 뛰어난 타이포그래피",
  "header": {
    "category": "범죄, 안전 및 사법 (빨간색 텍스트 및 빨간색 사각형 아이콘)",
    "headline": "{argument name=\"main headline\" default=\"1993 년 이후 범죄율은 50% 감소했습니다. 하지만 대다수의 미국인은 범죄가 증가하고 있다고 생각합니다. 두 사실은 동시에 존재합니다.\"}",
    "sub_headline": "미국 강력 범죄율 vs 대중의 인식 · 1990 년-현재 · BJS/FBI + GALLUP"
  },
  "chart": {
    "x_axis": "1990 년부터 2024 년까지 8개의 눈금 표시",
    "left_y_axis": {
      "color": "파란색",
      "label": "{argument name=\"left axis label\" default=\"인구 10만 명당 강력 범죄율\"}",
      "range": "200에서 800"
    },
    "right_y_axis": {
      "color": "빨간색",
      "label": "{argument name=\"right axis label\" default=\"'작년보다 범죄가 증가했다'고 답한 미국인 비율(%)\"}",
      "range": "20%에서 80%"
    },
    "data_series": [
      {
        "name": "현실",
        "style": "실선 파란색 선",
        "trend": "초기에 정점을 찍은 후 크게 하락",
        "annotations": [
          "1993 년 정점: 인구 10만 명당 747건의 강력 범죄 (파란색 점 포함)",
          "현실: 범죄율 감소 (선을 가리키는 파란색 화살표 포함)",
          "2024 년: 인구 10만 명당 376건, 1993 년 대비 약 50% 감소 (파란색 점 포함)"
        ]
      },
      {
        "name": "대중의 인식",
        "style": "점선 빨간색 선",
        "trend": "비교적 평탄하고 높은 수준 유지",
        "annotations": [
          "대중의 인식: 여전히 높은 수준... (선을 가리키는 빨간색 화살표 포함)",
          "2024 년: 62%가 범죄가 증가했다고 생각함 (빨간색 점 포함)"
        ]
      }
    ]
  },
  "callout_box": {
    "position": "차트 영역 왼쪽 하단",
    "style": "연한 노란색 직사각형",
    "icon": "전구",
    "text": "{argument name=\"callout text\" default=\"범죄율과 범죄에 대한 대중의 체감 사이에는 거의 상관관계가 없습니다.\"}"
  },
  "footer": {
    "text": "출처: {argument name=\"footer source\" default=\"법무통계국 NCVS · FBI 통합 범죄 보고서 · 갤럽 범죄 여론조사\"}"
  }
}
기계 번역 — 실제 결과물을 만든 것은 원문 프롬프트입니다.
원문 프롬프트
{
  "type": "editorial infographic dual-axis line chart",
  "style": "clean, newspaper-style, off-white background, highly legible typography",
  "header": {
    "category": "CRIME, SAFETY & JUSTICE (red text with red square icon)",
    "headline": "{argument name=\"main headline\" default=\"Crime is down 50% since 1993. Most Americans think it's going up. Both true simultaneously.\"}",
    "sub_headline": "US VIOLENT CRIME RATE vs PUBLIC PERCEPTION · 1990-PRESENT · BJS/FBI + GALLUP"
  },
  "chart": {
    "x_axis": "Years 1990 to 2024 with 8 tick marks",
    "left_y_axis": {
      "color": "blue",
      "label": "{argument name=\"left axis label\" default=\"VIOLENT CRIME RATE per 100,000 people\"}",
      "range": "200 to 800"
    },
    "right_y_axis": {
      "color": "red",
      "label": "{argument name=\"right axis label\" default=\"% OF AMERICANS WHO SAY 'CRIME IS UP FROM LAST YEAR'\"}",
      "range": "20% to 80%"
    },
    "data_series": [
      {
        "name": "Reality",
        "style": "solid blue line",
        "trend": "peaks early then drops significantly",
        "annotations": [
          "1993 PEAK 747 violent crimes per 100,000 (with blue dot)",
          "REALITY: Crime Has Fallen (with blue arrow pointing to line)",
          "2024 376 per 100,000 ~50% LOWER than 1993 (with blue dot)"
        ]
      },
      {
        "name": "Public Perception",
        "style": "dashed red line",
        "trend": "remains relatively flat and high",
        "annotations": [
          "PUBLIC PERCEPTION: Remains High... (with red arrow pointing to line)",
          "2024 62% think crime is up (with red dot)"
        ]
      }
    ]
  },
  "callout_box": {
    "position": "bottom left inside chart area",
    "style": "light yellow rectangle",
    "icon": "lightbulb",
    "text": "{argument name=\"callout text\" default=\"The crime rate and the public's feeling about crime have almost no relationship.\"}"
  },
  "footer": {
    "text": "SOURCE: {argument name=\"footer source\" default=\"Bureau of Justice Statistics NCVS · FBI Uniform Crime Reports · Gallup Crime Poll\"}"
  }
}