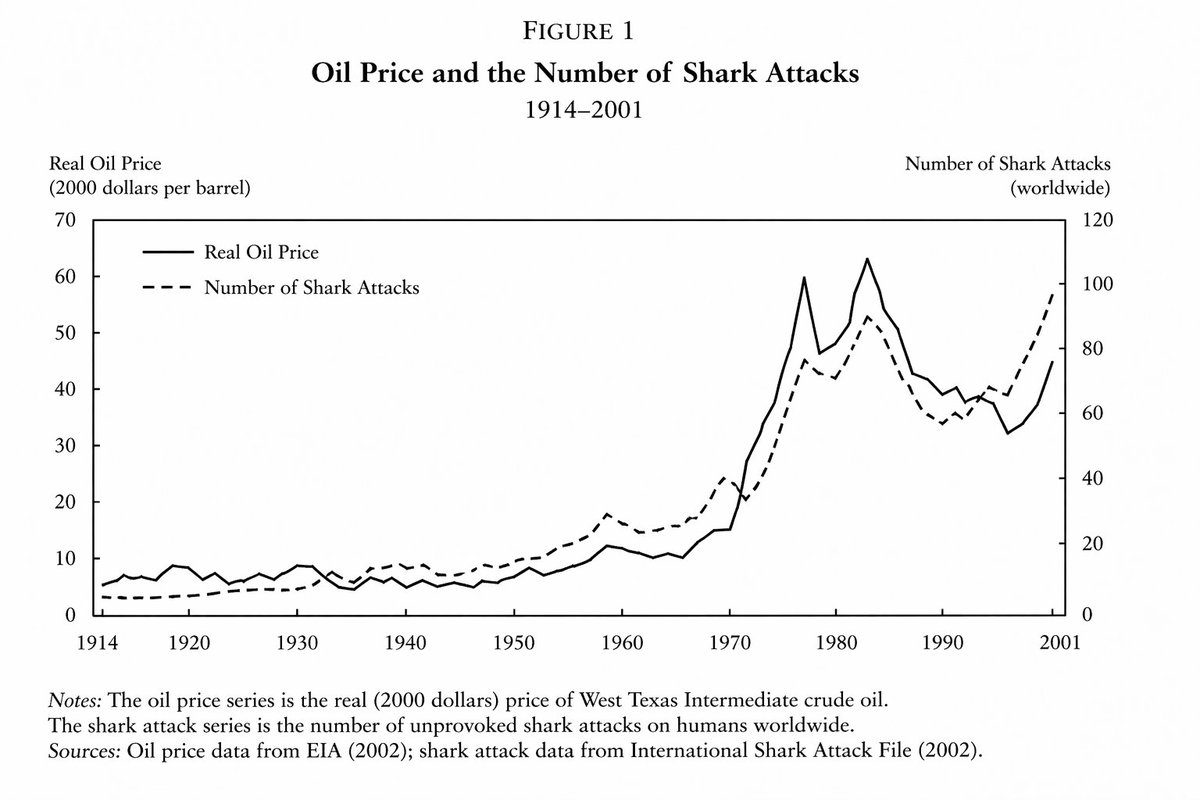
Academic Economics Chart Simulation
A prompt designed to generate highly realistic but fictitious academic charts, specifically showing a correlation between oil prices and shark attacks in an economics paper style.
ยอดดู8,600
ถูกใจ182
ความเห็น5
แชร์15
บุ๊กมาร์ก28
อ้างอิง7
line graph from an important and prestigious {argument name="field" default="economics paper"} demonstrating a close but not exact relationship between {argument name="variable one" default="the price of oil"} and {argument name="variable two" default="the number of shark attacks"} between {argument name="time period" default="the years of 1914 and 2001"}


