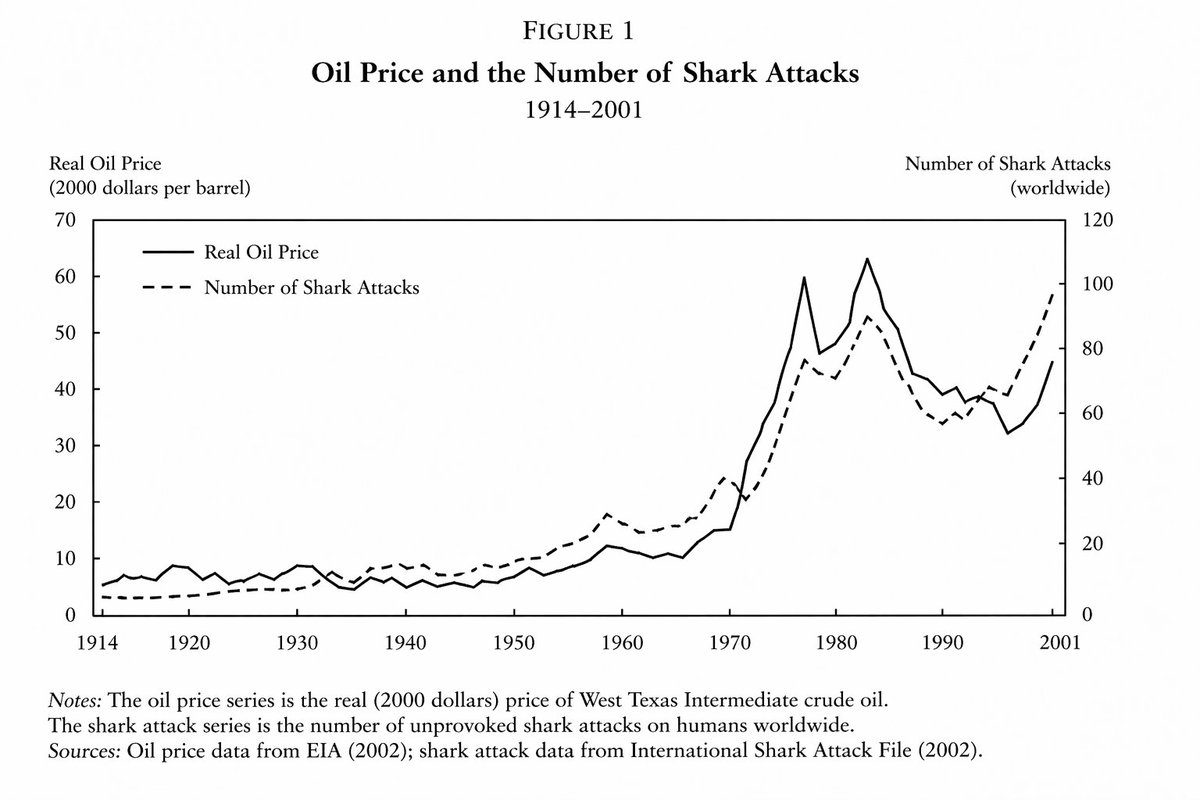
Academic Economics Chart Simulation
A prompt designed to generate highly realistic but fictitious academic charts, specifically showing a correlation between oil prices and shark attacks in an economics paper style.
조회8,600
좋아요182
댓글5
공유15
북마크28
인용7
번역
{argument name="time period" default="1914 년부터 2001 년까지"} 사이의 {argument name="variable one" default="유가"}와 {argument name="variable two" default="상어 공격 횟수"} 간의 밀접하지만 정확히 일치하지는 않는 상관관계를 보여주는, 중요하고 권위 있는 {argument name="field" default="경제학 논문"}의 선 그래프
기계 번역 — 실제 결과물을 만든 것은 원문 프롬프트입니다.


