Food Lifecycle Infographic Prompt
views23,300
likes471
comments8
shares66
bookmarks416
quotes4
Translated
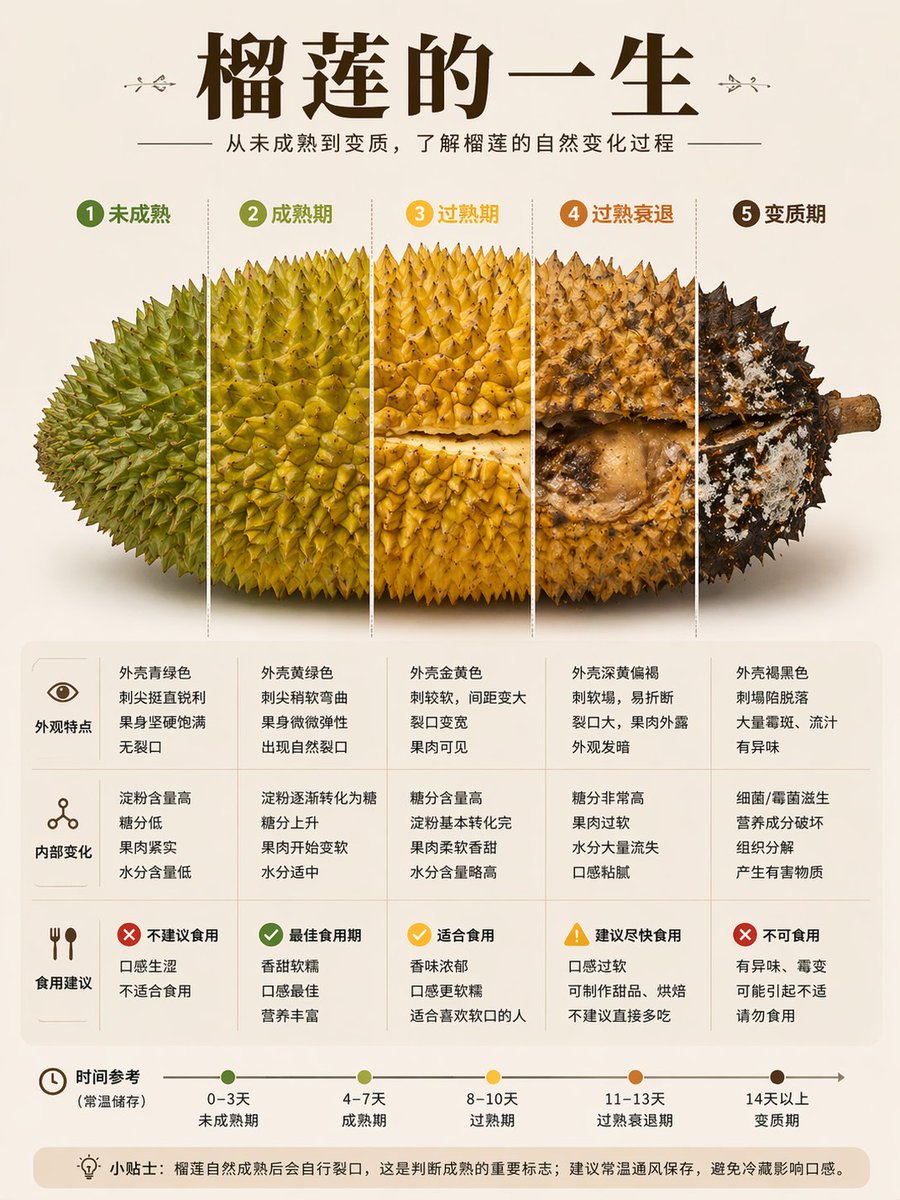
A scientific infographic with the theme "{argument name=\"food name\" default=\"garlic\"}'s life journey.

The image must feature "a single complete food item" (e.g., a potato / a bunch of bananas / a head of garlic),
shown through horizontal cross-sections to depict changes in the same food over different time stages, not multiple different foods spliced together.

The food subject maintains continuous structure and consistent shape, only presenting different maturity levels in different cross-section slices (as if time is sliced open).

The image is in vertical 3:4 ratio, with the subject centered and horizontally expanded, evenly divided into 4-6 segments:

From left to right: Unripe → Ripe → Overripe → Spoiled

Each segment reflects real changes:

Color changes (green → yellow → black, etc.)
Texture changes (plump → soft → shriveled → decayed)
Feature changes (sprouting, leaking, moldy, etc.)

Each stage is accompanied by text description:

Stage name
Appearance characteristics
Internal changes (sugar/starch/water content changes)
Edible recommendations (recommended / suitable for cooking / not edible)

Design style:

Minimalist light background (beige)
Highly realistic photographic style
Clear dividing lines (time-slice feel)
Chinese science popularization layout, Xiaohongshu style
Appropriate use of icons like ⚠️✔️

Title at the top of the image: "{argument name=\"food name\" default=\"garlic\"}'s life journey"

Key requirement: Must be shown as "cross-sections of the same food changing over time", not splicing of multiple individual pieces.
Machine-translated — the original is what produced this result.


